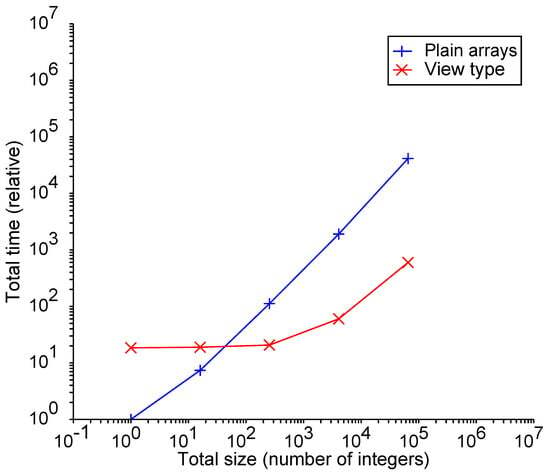
Tcl is often used in science, mostly behind the scenes. Here's a very recent article in the journal 'software' by Arjen Markus and Lenore Mullin:
"Implementing Mathematics of Arrays in Modern Fortran: Efficiency and Efficacy"
https://www.mdpi.com/2674-113X/3/4/26
It used the Tcl package 'plotchart' to produce the graphs in the paper. This is the package: https://core.tcl-lang.org/tklib/doc/trunk/embedded/md/tklib/files/modules/plotchart/plotchart.md


