mathstodon.xyz is one of the many independent Mastodon servers you can use to participate in the fediverse.
A Mastodon instance for maths people. We have LaTeX rendering in the web interface!

Server stats:

2.8K
active users

#labplot

1 post1 participant0 posts today

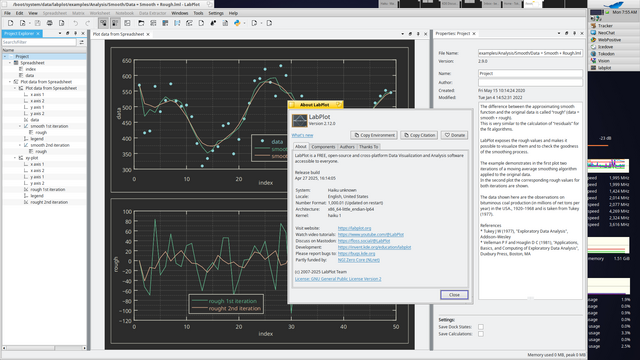
#LabPlot, the project for #statisticians, #researchers, #scientists, #engineers, #educators and #students, publishes version 2.12 of its #FREE comprehensive #dataAnalysis and #visualization tool. 🚀

This version adds more plots and #plot sub-types, expands the number of functions for spreadsheets, includes new analysis tools, as well as an experimental software development kit.

The project is partly funded through @NGIZero.

labplot.org/2025/04/28/labplot

@labplot@lemmy.kde.social

@opensource @labplot@lemmy.kde.social

Did you know that #LabPlot is listed in the French Interministerial Free Software Catalog as one of the recommended free applications for #French public agencies?

➡️ code.gouv.fr/sill/detail?name=

Keywords : Graphique scientifique, visualisation de données, traitement de données, analyse de données, statistiques, courbes

code.gouv.frSocle Interministériel des Logiciels LibresCatalogue de référence de logiciels libres recommandés pour l'ensemble de l'administration.
Replied to Mariusz Klimczak

@mariuszklimczak

Thank you for your interest in LabPlot.

LabPlot allows importing Origin project files. A list of LabPlot's features is available on the project website:
➡️ labplot.org

You can also check the available video tutorials:
➡️ youtube.com/@LabPlot/videos
➡️ youtube.com/watch?v=kVT5aKx8xg

A new version (2.12) is to be released very soon. If you want, you can also check a development version that includes many new features.
➡️labplot.org/download/

labplot.orgLabPlot – Scientific plotting and data analysis
Replied in thread

@JustEnoughDucks

Some benefits of #LabPlot:

👉 an interactive environment with a graphical user interface,
👉 ease of use for non-programmers,
👉 built-in tools for data analysis, statistics, regression, and curve fitting,
👉 platform integration that may offer a better experience than running Python scripts,
👉 possibility to run #Python, #Maxima, #R, #Octave and other languages inside LabPlot's computational notebooks.

Take a look at LabPlot's features:

➡️ labplot.org/features

labplot.orgFeatures – LabPlot

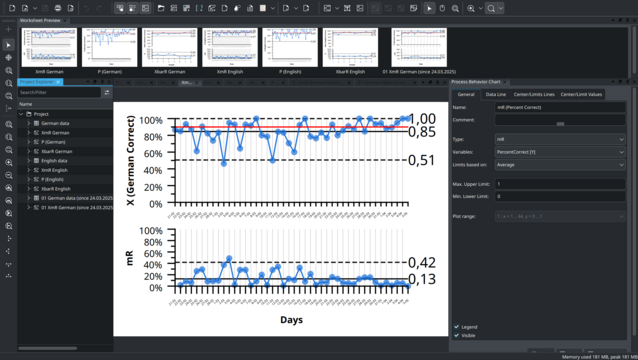
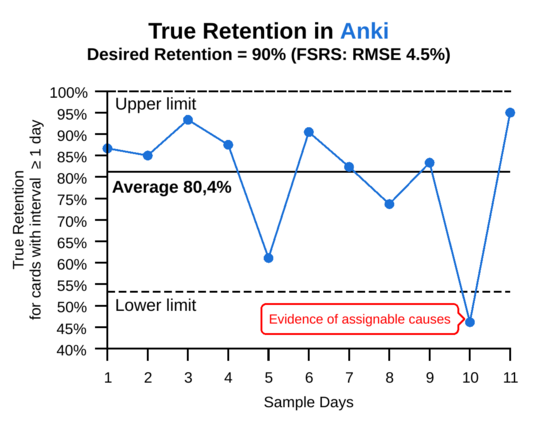
An example analysis of a #learning process with #LabPlot dev (P-chart).

@labplot@lemmy.kde.social @opensource

👉 The process is off the target and has large variation. Variation always creates costs.
👉 The point outside the limits is evidence that assignable causes with dominant effects are present and the process will behave UNPREDICTABLY.

'With an unpredictable process, PREDICTION IS FUTILE, but action may be taken to move the process closer to its full potential.' D.J. #Wheeler

Today I posted my first "Issue" / Bug Report to the amazing #FreeSoftware data analysis tool, #LabPlot . I am using it on Windows at work, to make nice graphs for my classes, and try to push it as hard as possible, to discover issues, and be able to make suggestions to improve usability.

So, I hope the issue I found will help the team improve the product, and I hope I will be able to give useful feature suggestions based on my experience.

@LabPlot

How to visualize #server #metrics in #RealTime via #TCP in @LabPlot ?

@labplot@lemmy.kde.social @sysadmin@lemmy.world @sysadmin@lemmy.ml @cybersecurity

The purpose of this simple tutorial is not to position #LabPlot against dedicated applications, but rather to show how its "Live Data" functionality can be used to read and visualize data in real time.

👉 docs.labplot.org/en/tutorials/

#LabPlot is a FREE, open source and cross-platform Data Visualization and Analysis software accessible to everyone. In LabPlot your #data is yours alone!

In this short video you can learn how to quickly import your data into #LabPlot and visualize it.

Boosts appreciated! :boost_love:🚀

@opensource @openscience @alternativeto @9to5linux @omgubuntu

➡️ youtube.com/watch?v=Ngf1g3S5C0