
It's #TidyTuesday y'all! Show us what you made on our Slack at https://dslc.io/join (find the #chat-tidytuesday channel)!
RT @jonthegeek https://fosstodon.org/@jonthegeek/114376279976367936

It's #TidyTuesday y'all! Show us what you made on our Slack at https://dslc.io/join (find the #chat-tidytuesday channel)!
RT @jonthegeek https://fosstodon.org/@jonthegeek/114376279976367936
For this week's #TidyTuesday data about car crashes in the USA, I decided to take the simple approach of plotting every data point.
 Jittered scatter plot made with #ggplot2
 Over 1.3 million points drawn
 Noticeable reduction after 2008 (ish)
Code: https://github.com/nrennie/tidytuesday/tree/main/2025/2025-04-22

Curator: @jonthegeek
https://DSLC.io welcomes you to week 16 of #TidyTuesday! We're exploring Fatal Car Crashes on 4/20!
 https://tidytues.day/2025/2025-04-22
 https://osf.io/preprints/osf/tzcsy_v1
Submit a dataset! https://github.com/rfordatascience/tidytuesday/blob/main/.github/CONTRIBUTING.md
 overlaying a black paint splash.")

 is approximately in the middle of fatality counts for April. Error bars on both plots are noted as representing 95% bootstrapped confidence intervals. Both plots were generated using code provided by @Rmadillo on GitHub.")
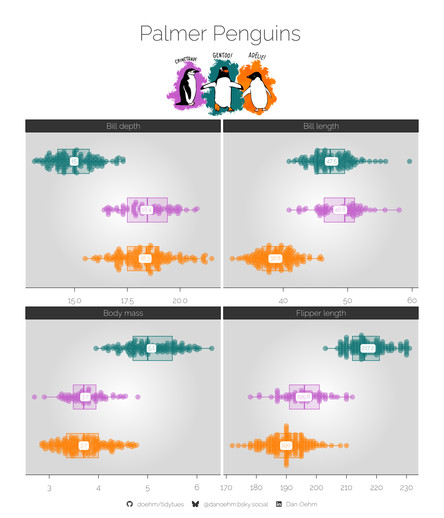
#TidyTuesday week 15: Base R Penguins  Code
Code  github.com/doehm/tidytu...
Gallery github.com/doehm/tidytues
#dataviz #Rstats #ggplot2
github.com/doehm/tidytu...
Gallery github.com/doehm/tidytues
#dataviz #Rstats #ggplot2
#TidyTuesday – 2025 W15 | Base R Penguins
.: https://stevenponce.netlify.app/data_visualizations/TidyTuesday/2025/tt_2025_15.html
.
#rstats | #r4ds | #dataviz | #ggplot2
 for three penguin species with density contours. The plot clearly displays three distinct clusters: Adelie penguins (orange, n=152) with shorter, deeper bills centered around 40mm length; Chinstrap penguins (blue, n=68) with medium-length bills around 49mm and greater depth; and Gentoo penguins (green, n=124) with longer, shallower bills around 48mm length and 15mm depth. Diamond markers indicate species means.")
A quick plot for #TidyTuesday this week - celebrating the addition of the `penguins` data into base R I used {ggdist} to visualise the distribution of body weights with four different chart types in one!
I couldn't quite decide whether I prefer the light or dark version
Code: https://github.com/nrennie/tidytuesday/tree/main/2025/2025-04-15


It's #TidyTuesday y'all! Show us what you made on our Slack at https://dslc.io/join (find the #chat-tidytuesday channel)!
RT @jonthegeek https://fosstodon.org/@jonthegeek/114336585969522119
My #rstats friends - R-Ladies Canberra x Melbourne x Sydney are thrilled to bring you a #TidyTuesday event! 
Come along, connect with the community + stretch your data muscles  All coding experience levels are welcome!
 : Tue May 6
  : 1:00 PM AEST
 : bit.ly/42rFX2D
We can't wait to see you there!

Curator: @jonthegeek
https://DSLC.io welcomes you to week 15 of #TidyTuesday! We're exploring Base R Penguins!
https://tidytues.day/2025/2025-04-15 https://zenodo.org/records/14902740
Submit a dataset! https://github.com/rfordatascience/tidytuesday/blob/main/.github/CONTRIBUTING.md
 overlaying a black paint splash.")

 and bill length (y-axis, in mm) for three penguin species at Palmer Station LTER. Adelie penguins are represented by orange circles with a slight positive trend line. Chinstrap penguins are shown with purple triangles, clustering higher on the bill length axis and a steeper trend line. Gentoo penguins are shown with dark green squares, positioned farther right along the flipper length axis, with their own upward trend line. A legend at the bottom right indicates the color and shape used for each species. The image is from the palmerpenguins R package.")
For this week's #TidyTuesday, we're looking at healthcare efficiency in the USA  I wanted to create a very minimalist data-art plot, with tooltips that give more information
 Map grid from {geofacet}
 Interactive tooltips with {ggiraph} Styling with CSS

It's #TidyTuesday y'all! Show us what you made on our Slack at https://dslc.io/join (find the #chat-tidytuesday channel)!
RT @jonthegeek https://fosstodon.org/@jonthegeek/114297010745251048
Curator: @jonthegeek
https://DSLC.io welcomes you to week 14 of #TidyTuesday! We're exploring Timely and Effective Care by US State!
https://tidytues.day/2025/2025-04-08 https://www.visualcapitalist.com/mapped-emergency-room-visit-times-by-state/
Submit a dataset! https://github.com/rfordatascience/tidytuesday/blob/main/.github/CONTRIBUTING.md
 overlaying a black paint splash.")


We're looking at Pokemon data for #TidyTuesday this week!
Stream plot showing speed and colour using {ggstream} Image added with {ggimage}
 Aiming for a minimalist, fun, and arty chart
Code: https://github.com/nrennie/tidytuesday/tree/main/2025/2025-04-01

#30DayChartChallenge - Day 1: Fractions Everyone's talking about Trump and tariffs but how much longer do we have to put up with his crap? Sadly, we're just under 5% of the way through so have a long way to go. #rstats #dataviz #TidyTuesday
It's #TidyTuesday y'all! Show us what you made on our Slack at https://dslc.io/join (find the #chat-tidytuesday channel)!
RT @jonthegeek https://fosstodon.org/@jonthegeek/114257310205493006

https://DSLC.io welcomes you to week 13 of #TidyTuesday! We're exploring Pokemon!
https://tidytues.day/2025/2025-04-01 https://medium.com/@hanahshih46/pokemon-data-visualization-and-analysis-with-r-60970c8e37f4
Submit a dataset! https://github.com/rfordatascience/tidytuesday/blob/main/.github/CONTRIBUTING.md
 overlaying a black paint splash.")


It's #TidyTuesday y'all! Show us what you made on our Slack at https://dslc.io/join (find the #chat-tidytuesday channel)!
RT @jonthegeek https://fosstodon.org/@jonthegeek/114217675218155198
A simple, minimalist filled slope chart for this week's #TidyTuesday data about words found in Amazon's annual reports
Code: https://github.com/nrennie/tidytuesday/tree/main/2025/2025-03-25
Heavily inspired by this chart from @danoehm: https://raw.githubusercontent.com/doehm/tidytues/refs/heads/main/scripts/2023/week-23-energy/energy.png


 and Rock near the top (slowest). Purple diamonds mark the mean speed for each type, and a vertical dashed line at 100 indicates the \"Fast\" threshold. Most Pokémon fall between 50-100 speed, with outliers reaching up to 150.")